
Democracy vs. Success: How form of government affects a countries success
Government affects all our lives. This post shows how to collect data on democracy level and measures of success through web scraping.
Introduction
Understanding the relationship between a nation’s form of government and its overall success is crucial in comprehending global dynamics. In this post, we leverage data collection techniques to explore how different government systems impact key economic and health metrics.
Metrics used
We begin our analysis by examining democracy rankings across different countries. Utilizing data from Democracy Matrix, we compile a list of countries alongside their corresponding democracy index values and classifications. We will then use several sets of date from Worldometer
Data Collection
Tools
I used Python and the BeautifulSoup and Pandas packages to collect and modify my data.
import requests
from bs4 import BeautifulSoup
import pandas as pd
Step 1: Import Democracy Data
To start imported the data I needed from Democracy Matrix using the following code
url1 = 'https://www.democracymatrix.com/ranking'

response = requests.get(url1)

soup = BeautifulSoup(response.text, 'html.parser')

table = soup.find('table')

headers = [th.text.strip() for th in table.find_all('th')]

rows = []
for row in table.find_all('tr'):
    rows.append([td.text.strip() for td in row.find_all('td')])

democracy = pd.DataFrame(rows[1:], columns=headers)
Following that I did a little bit of cleaning of header names as well as had to rename a few Countries so that they would be consistant for me when I joined them with later data
democracy.columns=['democracy rank','Country','Democracy index value','Democracy classification']
democracy=democracy[['Country','Democracy index value','Democracy classification']]
country_name_mapping = {
    "United States of America": "United States",
    "Congo, Republic": "Congo",
    "Congo, Democratic Republic": "DR Congo",
    "Vietnam, Democratic Republic": "Vietnam",
    "Burma/Myanmar":"Myanmar",
    "Czech Republic":"Czech Republic (Czechia)",
    "The Gambia": "Gambia",
    "São Tomé and Príncipe":"Sao Tome & Principe"
}
democracy['Country'] = democracy['Country'].replace(country_name_mapping)
Step 2: Import Success metrics
Next I import the other three datasets I will be using from Worldometer.
url2 = 'https://www.worldometers.info/world-population/population-by-country/'

response = requests.get(url2)

soup = BeautifulSoup(response.text, 'html.parser')

table = soup.find('table', {'id': 'example2'})

headers = [th.text.strip() for th in table.find_all('th')]

rows = []
for row in table.find_all('tr'):
    rows.append([td.text.strip() for td in row.find_all('td')])

pop= pd.DataFrame(rows[1:], columns=headers)
url3 = 'https://www.worldometers.info/gdp/gdp-per-capita/'

response = requests.get(url3)

soup = BeautifulSoup(response.text, 'html.parser')

table = soup.find('table', {'id': 'example2'})

headers = [th.text.strip() for th in table.find_all('th')]

rows = []
for row in table.find_all('tr'):
    rows.append([td.text.strip() for td in row.find_all('td')])

gdp= pd.DataFrame(rows[1:], columns=headers)
url4 = 'https://www.worldometers.info/demographics/life-expectancy/'

response = requests.get(url4)

soup = BeautifulSoup(response.text, 'html.parser')

table = soup.find('table', {'id': 'example2'})

headers = [th.text.strip() for th in table.find_all('th')]

rows = []
for row in table.find_all('tr'):
    rows.append([td.text.strip() for td in row.find_all('td')])

life= pd.DataFrame(rows[1:], columns=headers)
Following reading in these datasets I want to rename several columns as well as make it so I only have selected the ones that I feel are most useful. These columns will include population, population density, land area, migration, fertility rates, GDP per capita (both PPP and nominal), and life expectancy (total and divided by sex)
pop.columns=['pop rank','Country','Population(2023)','change(year)','change(net)','Density(p/Km^2)','Area(Km^2)','Migration(Net)','Fertility','median age','percent urban','percent world']
pop=pop[['Country','Population(2023)','Density(p/Km^2)','Area(Km^2)','Migration(Net)','Fertility']]
gdp.columns=['gdp rank','Country','GDP PPP per captita','Nominal GDP per capita','vs world']
gdp=gdp[['Country','GDP PPP per captita','Nominal GDP per capita']]
life.columns=['rank expectancy','Country','Total Life expectancy','Female Life Expectancy','Male Life Expectancy']
life=life[['Country','Total Life expectancy','Female Life Expectancy','Male Life Expectancy']]
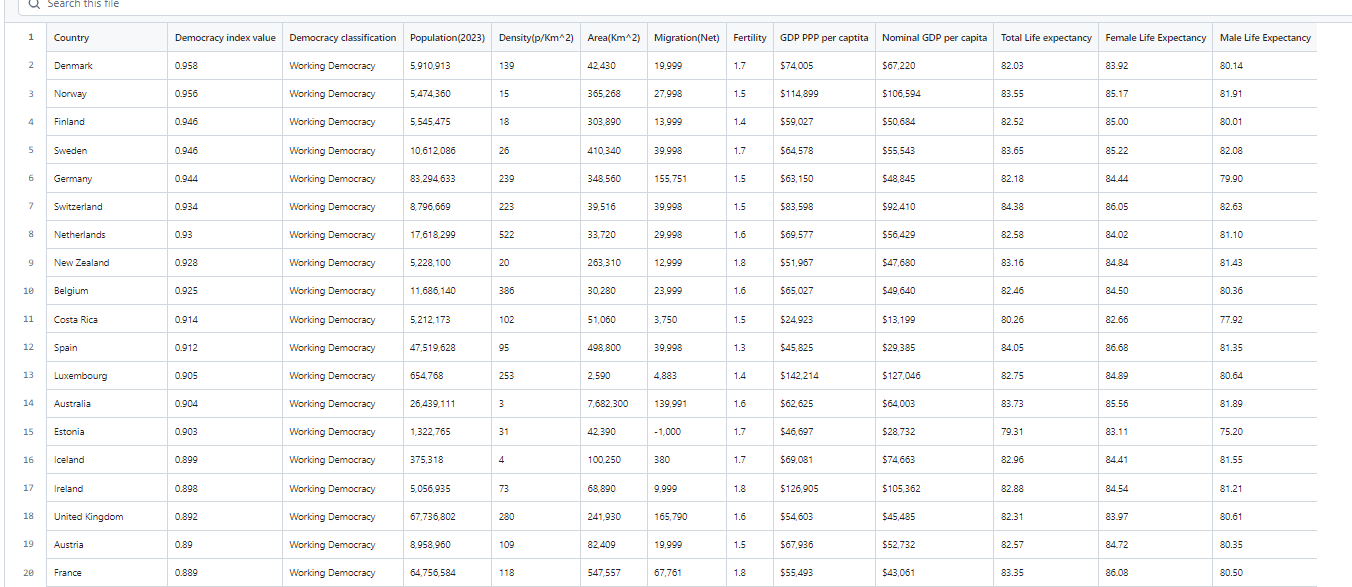
Step 3: Merge the data sets
Now that all the individual datasets have been brought in now we want to merge them. We will do so with the following code and save it as a csv file
democracy_pop = pd.merge(democracy, pop, on='Country', how='outer')

gdp_life = pd.merge(gdp, life, on='Country', how='outer')

merged_table = pd.merge(democracy_pop, gdp_life, on='Country', how='outer')

merged_table.to_csv('merged.csv',index=False)
And now we have our data!!!
Conclusion
In this blog we have explored reading in data to show the way in which various types of government can affect the success of a nation. This data can help us get a look at what governments can do if they want to have a better system for their citizens.